SafeCurves
Save lives and enhance road safety.

Our approach to managing road safety must change.
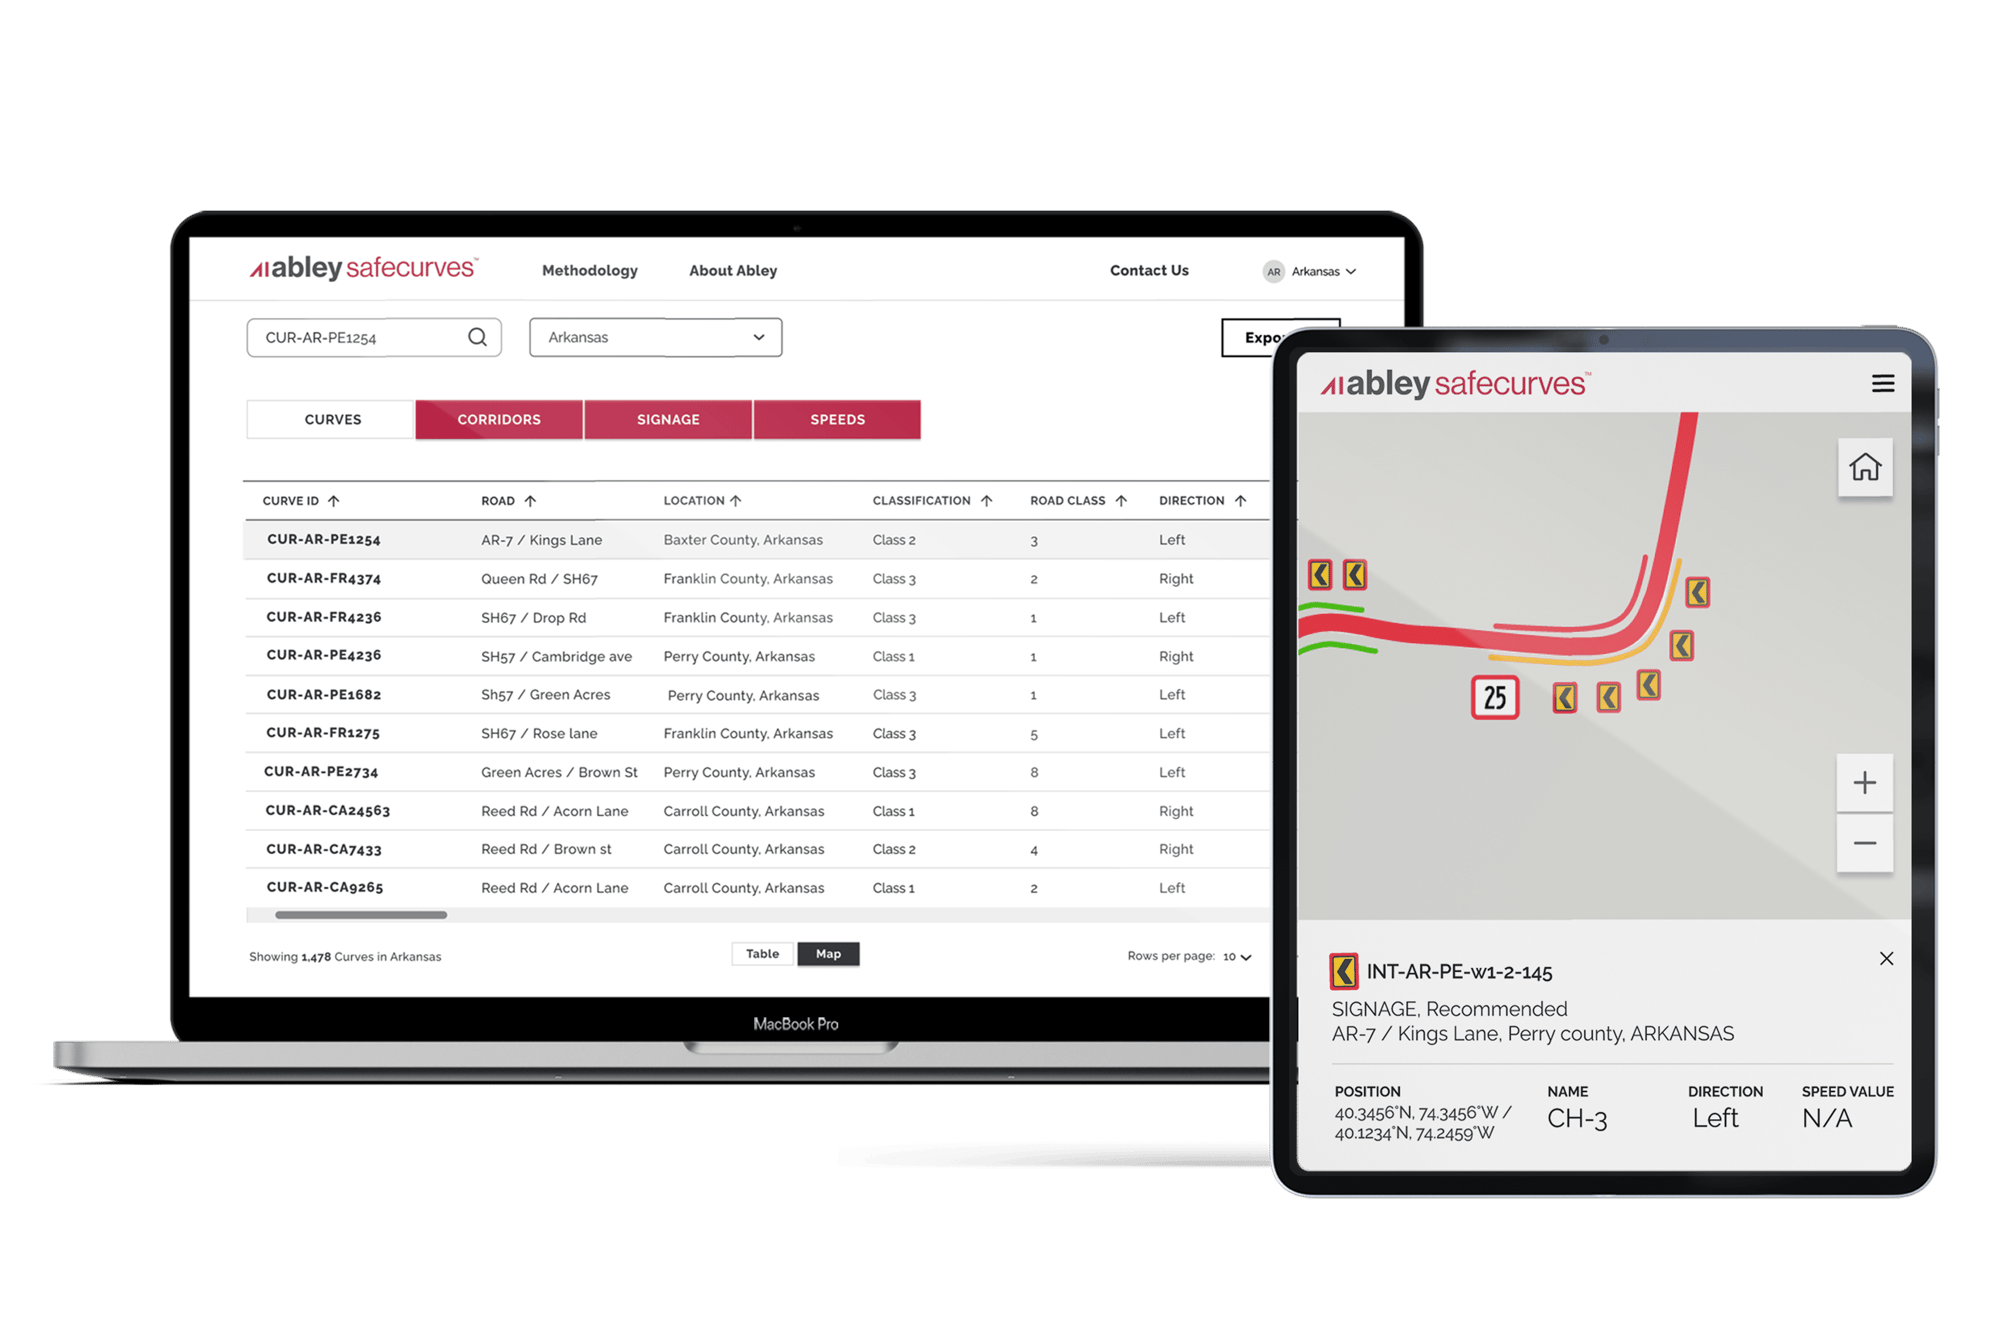
Access to comprehensive data is crucial. SafeCurves provides a faster and more effective data-driven approach for road safety practitioners to identify high-risk curves across an entire State Highway network.
SafeCurves features three integrated modules
Systemically and proactively identify and address risks
Proactively assess risk based on crash potential, not just crash history.
Direct investment to locations with the greatest potential for impact, ensuring efficient use of resources.
Deliver uniform, consistent treatments that comply with Federal standards.
Save time compared to traditional in-field inspections.
Access data instantly and seamlessly integrate it with your existing processes.
Learn how SafeCurves can help your organization
Book a call ›
Empower Your Road Safety Efforts
With SafeCurves, swiftly and effectively identify, prioritize, and implement countermeasures for high-risk curves. This proactive approach saves lives by addressing potential dangers before crashes occur.

Key Product Features
-
Identify locations for improvement - Evaluate curves based on risk factors including speed, geometry, terrain, and superelevation.
-
Prioritize corridors for investment - Categorize corridors based on risk.
-
Design countermeasures based on Federal standards - Determine advisory speed and warning signs.
-
Centerline data - Leverage HERE’s automotive-grade road centerline data.
-
Integration - View the data using GIS software.
The Safe System Approach to saving lives
There are five pillars in the Safe System Approach to road safety. One of the foundational principles in the Safe System is that Safety must be proactive.
We shouldn’t wait for crashes to occur, before addressing risk. Instead, the proactive approach involves using data-driven tools to identify and address potential risks
SafeCurves is the proactive solution to help reduce road trauma on our highways. To learn more, book a call.


Did you know the U.S. has over 900,000 horizontal curves
that are out-of-context with the road environment?
In 2021, 42,939 people died on America’s roads. A large proportion of these deaths were associated with crashes on horizontal curves.
Horizontal curves are one of the most challenging features on high-speed rural roads. The average crash rate on horizontal curves is approximately three times higher than straight sections of road (FHWA, 2023).
Drivers can be surprised by curves that are inconsistent with what they are expecting, elevating the risk of roadway departures and head-on collisions. These types of curves are regarded as ‘out-of-context’ – the sharpness of the curve is out-of-context with the driver’s experience prior to reaching the curve.
Examples of out-of-context curves include:
-
an isolated curve on an otherwise long and straight road;
-
the first curve entering a series of curves; and
-
an unexpectedly sharp curve among a sequence of larger-radii curves.
- What causes crashes?
- How might we mitigate crashes?
- How can we identify improvements?
What causes crashes on horizontal curves?
Research suggests that the primary causes of crashes on horizontal curves include:
-
complex geometry;
-
excessive speed;
-
drivers’ unawareness or misjudgement of the approaching curve; and
-
environmental conditions, such as visibility or weather.
How might we mitigate crashes on horizontal curves?
There are several low-cost countermeasures which can reduce the risk of drivers leaving the roadway on a curve. These include line markings, curve advisory speeds, warning signs and improving the skid resistance of the road surface. Widening the shoulder and installing roadside barrier also minimizes the severity of a crash, should a loss of control occur.
How can we identify horizontal curves for improvement?
Site analysis
Traditionally, identifying curves for safety improvements involved looking at crash data to find blackspots and trends. Many high-risk curves were only treated after a serious crash had occurred. This approach is reactive, as you need crashes to occur before you can address deficiencies. Chasing crash hotspots fails to address sites where serious crashes could occur in the future. This effect is magnified on low-volume rural roads where crashes are relatively rare and are dispersed across the road network.
Moving to a systemic approach
Rather than waiting for crashes to occur, the systemic approach proactively evaluates risk across an entire roadway system. It is focused on looking for characteristics which are frequently present in severe crash types – for example road geometry or traffic volume. By using a systemic approach, we can identify improvements based not only on crash history but also on crash potential.
Learn how SafeCurves can help your organization
Gain road safety insights with our FREE Diagnose Report
Uncover the scale of your road safety challenges for your jurisdiction with SafeCurves.
Download your free report for the US
Or submit your request for a Diagnose report for your county or state.
Choose the perfect solution for your organization
We offer a range of packages and plans to suit your needs.
Frequently asked questions
SafeCurves categorizes curves into Class 1, 2 or 3 depending on whether they are:
-
unacceptable (Class 1)
-
undesirable (Class 2)
-
desirable (Class 3)
The design limit is determined by the combination of the approach speed, and the curve radius. For example, a tight radii curve can be desirable if drivers approach it at a low speed, or unacceptable if drivers approach it at high speed.
The ‘undesirable’ and ‘unacceptable’ design limits are considered out-of-context, with ‘unacceptable’ being more out-of-context than ‘undesirable’.
SafeCurves: Identify has been applied to all high-speed ≥40mph roads in the USA covering approximately 213,000 miles of roads and identifying over 1,725,000 horizontal curves.
The outputs have been validated against data contained in the National Highway Traffic Safety Administration (NHSTA) Fatality Analysis Reporting System (FARS).
While only 2% of the network was classified as ‘unacceptable’ curves, this category of highway had the highest average number of fatal crashes. The fatal crash rate on ‘unacceptable’ curves is 1.4 times that of ‘desirable’ curves and 2.1 times that of straights. This suggests that ‘undesirable’ and ‘unacceptable’ curves are high-risk curves. The implication is that targeting interventions at high-risk curves will yield greater road safety benefits and provide a greater return on investment.
SafeCurves is provided via an access key so that you can either use the SafeCurves App on your desktop or mobile device and via your preferred GIS platform, or you can access the data as a GDB.
Book a call
Book a call with Steve to discuss your organization's challenges and learn how SafeCurves can deliver effective solutions.
We are passionate about inspiring positive change.
Abley is a specialist New Zealand owned transport planning, road safety and geospatial technology company. Founded in 2003, we work with organizations in the U.S., Canada, New Zealand, Australia and Indonesia, across central and local governments as well as large organizations.


