


Recent research by Flow Transportation Specialists and Auckland Transport, featured in The Conversation[1], shows how crashes can cause major productivity losses across our transport network.
Developed independently, but with an aligned goal, our new study builds on this by measuring the total delay costs from serious crashes using TomTom Area Speed analysis. Unlike other methods, we don’t need to identify and map out specific detour routes – we look at the whole network to see the real overall impact.
By combining Abley’s expertise in integrating connected vehicle data and crash records, and using FME software for automated, scalable processing, we’ve created a method that tracks how crashes affect travel times and congestion across the network. Using TomTom Move data, traffic counts, and signal data, we can now put a dollar value on the broader economic impacts of these disruptions. This helps us make better decisions about where to invest in safety and resilience.
As highlighted in The Conversation, underestimating crash costs by just 3–10% can mean safety upgrades lose out in cost-benefit analyses, even when they should be prioritised. This is doubly important when funding agencies are required to frame capital spending in terms of network productivity and efficiency – not only may safety projects be inaccurately deprioritised but projects which increase risk factors, such as operating speed and VKT, may be treated preferentially. Our research aims to understand this gap by providing a more complete picture of the true costs of crash-related delays.
We analysed five recent crashes which resulted in either full or partial road closures, spread across different road types, crash types, and closure lengths. Key findings from the case studies show:
-
Network disruption costs for the crashes investigated ranged from $150,000 to over $10.5 million per incident.
-
Major urban closures (e.g., Tamaki Drive, Auckland) resulted in 39,300 hours of additional vehicle delay and up to 432,000 km of extra vehicle travel. Network delay costs were estimated at $10.5M, an additional 70% over the social cost alone.
-
Even short closures on key corridors (e.g., Christchurch Southern Motorway) caused 5,750 hours of extra vehicle delay and costs exceeding $1.7 million, an additional 11% over the social cost alone.
-
Rural incidents with longer detour routes (e.g., SH6 Kingston) led to 2,200 hours of additional vehicle travel time and 210,000 km of detours. Network delay costs were estimated at $830k, an additional 5.5% over the social cost alone.
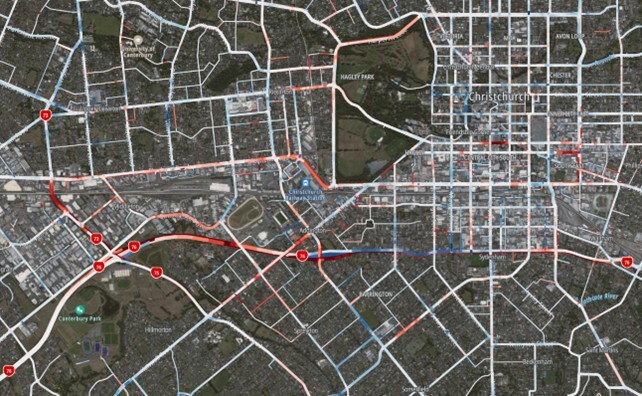
Image 1 – CSM closure impacts 17-09-2025 16:00 – 17:00
These initial proof of concept case studies demonstrate that including network delay costs in cost-benefit analyses may alter the balance of prioritisation, with additional cost of between 5% and 70% over the social costs alone. Also, in combination with the Flow / AT analysis it is clear that there is a large range of impacts even between similar crash types and locations. Developing a framework to assess the root causes of these differences is a key future aim of this research.
By automating this analysis at scale, we can better identify where safety improvements will have the biggest impact—saving time, money, and lives. This research would also continue to expand the evidence base required for standardising productivity impacts into safety and resilience projects.
I will be jumping on my soapbox to present this research at the ENZ Transportation Group conference in March 2026; I’m looking forward to sharing insights and discussing how we can better value the total impact of safety investment.
[1] https://theconversation.com/higher-speeds-lower-productivity-what-the-data-shows-crash-delays-really-cost-auckland-271734