Data is a big industry these days, with endless streams of information available at our fingertips. It informs our decisions, helps us to uncover new insights, validate research and make predictions.
There can be limitations though. What if the data is messy, or pieces are missing? Thankfully, when it comes to crash data, the New Zealand Police and other road safety partners do a good job in capturing quality data. However, as with any data set, inconsistencies can occur, which can make it difficult to reach conclusions.
To dive deeper into the crash data, we’ve been modelling different types of crashes and making comparisons. We’ve found the main factors to be mostly as expected – road curvature is a big one! Of course, any results need to be carefully interpreted within the wider context.
 A picture paints a thousand words
Looking at data differently can help us to see things in new ways. So, for an alternative approach, we’ve been looking at text features in the crash dataset – these are the written notes attached to the crash data.
Splitting sentences up into words and word pairs allows us to measure the frequency, importance and sentiment of each one. One way to explore the highest-scoring words is to visualise them in a word cloud. Other options include looking into “topics” contained within the texts, examining the tone of writing, or building a model to automatically classify new text data.
Testing sight distance with SafeView
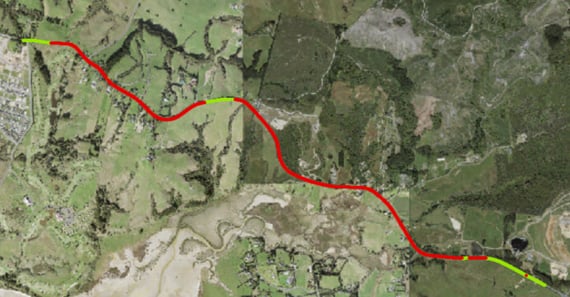
Previously, we identified road sections where it might be interesting to test the sight distance using SafeView. This requires high resolution LIDAR data, which we downloaded for free from LINZ’s data service. Coverage is mostly limited to urban areas, although this is being continually extended, and there are also other companies, such as HERE, which also provide nationwide LIDAR coverage for roads.
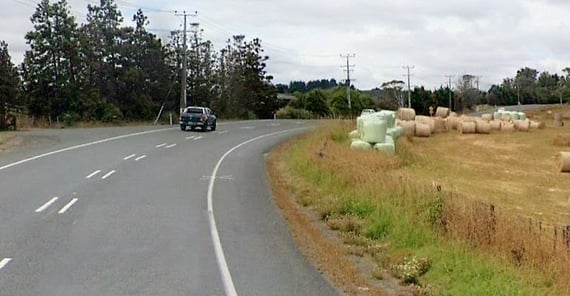
One section with high traffic volumes only had a small window where sight distance would allow for overtaking. Looking on Google Street View showed hay bales on the side of the road were completely obstructing this visibility at the time of capture. You never know what you’ll find!


Finishing up
It’s now time to finish up modelling and analysis. Next, I will start piecing together a final report so I can share my findings with others. My final blog will touch on my key findings and discuss where the project could be taken in the future.


