

 Abley reduce commuting emissions by 33%" style="object-fit: cover;object-position: center;width:100%;height:100%;" fetchpriority="high" decoding="sync"/>
In September 2020, we conducted a routine staff survey measuring how Abley team members commute to the Christchurch and Auckland offices. As a company with a professional focus on sustainable transportation, monitoring our own commuting CO2 emissions is important to us, to help inspire positive change.
Combined with the pre-lockdown survey conducted in March 2020, the recent results enable a fascinating comparison that illustrates just how COVID-19 has impacted our commuting habits apace with our internal efforts to lower our commuting carbon emissions.
Our Latest Travel Patterns
Modal Split of Recorded Commuting Trips (September 2020)

The glaring disparity between March and September’s results is the increase in staff electing to work from home from 1.4% to 13.7% of all working days. This is most notable in the Auckland office where 23% of working days were from home. The COVID-19 pandemic and associated precautions we took, alongside our flexible working policy, are likely to be the driving forces behind the increase.
Aside from more staff opting to work from home, generally our findings from September show consistency with our pre-COVID figures. Non-sustainable travel (red areas in chart above) and sustainable travel (green areas in chart above) remain proportionately similar to the previous results, when considering that working from home (blue areas in chart above) equates to a zero emissions commute. Non-sustainable modes of transport such as cars and motorcycles remain near-statistically identical.
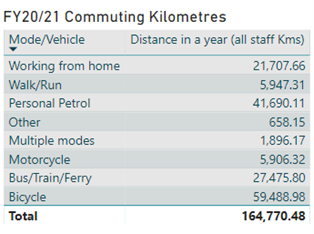
It seems that the increase in working from home has almost entirely eroded the share of cycling and public transport use, which is a trend to watch. However, Abley retains a large share of active travel at 48% of all commutes. The strong foundations of our cycling culture are on full statistical display in several areas. As mentioned in our March assessment, while most cyclists are men, at Abley, women are more likely to cycle than men at 37% of their commuting trips versus 33% for men. Not only does our Christchurch office boast a high percentage of staff cycling to work at 45%, but as a company overall we cycle 18,000kms more than we drive in a year! We also saved 21,707 kilometres worth of commuting by working from home.
The Carbon Emissions Case
Cutting down our commuting carbon emissions is a key focus for many of our team members as we aim to lead by example in the space of sustainable commuting.
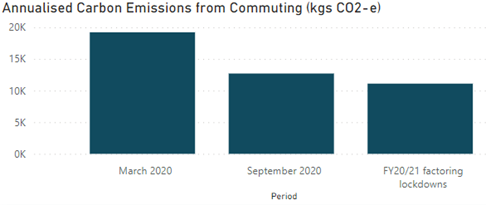
Our annualised carbon emissions have reduced by 33% from March to September. In raw estimated numbers, our annualised commuting carbon emissions have decreased from 19.2 tonnes of CO2 equivalent pre-COVID to 12.7 tonnes for the financial year of 2020/21, without even factoring the weeks under lockdown. If we were to factor in the lockdowns, that figure would drop further to 11.1 tonnes, or a 42% drop in commuting emissions from the pre-COVID baseline.
Team members electing to work from home more often (and therefore to not commute) is likely to have had a significant impact on reducing our commuting carbon emissions. Working from home is also more attractive to those with long commutes as their time and cost saving is higher everytime they avoid commuting. We suspect there could have been a reduction in long distance commuting which, if driven, are the highest emitting.
Having shown significant progress towards reducing commuting emissions with our flexible working policy, we are excited to see how much further our organisation can decrease our carbon footprint, as we continue to monitor our commuting habits.