

The ArcGIS API for JavaScript version 4.x supports a type of feature layer, which is constructed and rendered client-side. The client-side feature layer is well supported by ESRI and has been recommended over graphics layer for most cases: "It is generally preferred to construct a FeatureLayer with its source property when working with client-side graphics since the FeatureLayer has more capabilities than the GraphicsLayer, including rendering, querying, and labelling." [ESRI, n.d.].
Lately I have been investigating Esri's Experience Builder custom applications, specifically investigating the new JSON feature set that allows dynamic symbology and labelling. When users update data within an application, this action will trigger the map to respond instantaneously, updating graphics, symbols and labels on map. The data is saved on the client locally, round trips to the Feature Service backend are avoided as there are no network calls. This significantly improves the user experience. Traditionally my approach would be to apply server-side feature services to persist data or a graphic layer to display symbology and labels, however the client-side feature layer out-performs both these approaches.
How to handle dynamic label change (on the fly editing)
You can change the data in the client-side feature layer using the applyEdit API method. In the below example (Figure 1), let's say, I make a change to the NAME field of a feature, this is achieved by typing data into an HTML input text field on each key stroke.
The applyEdit call saves the data to the client-side feature layer on each key stroke, the application then instantly displays the value on the map feature label. The map renderer will take a moment to display the map label, I will see the label being typed on the map as I type a key on the HTML input text box. In my opinion, the performance of displaying labels on the map when using the applyEdit call is solid because the lag between inputting the key stroke and subsequent labelling on the map is fast.
At a later stage in the application workflow, this client-side data could also be saved to the server-side feature layer for data to persist in the database (again using the applyEdit call to the feature service).
function onInputChange(event) {
    // on every key stroke input, the text is sent as event.target.value to the applyEdit call.
    const keyInput = sanitizer.sanitize(event.target.value); // Sanitize to avoid XSS attacks
    feature.attributes.NAME = keyInput;
    return layer
        .applyEdits({ updateFeatures: [feature] })
        .catch((err) => console.log(err));
}
Figure 1 – Defining key input change
Symbolising graphics
The key to client-side symbology is to define a renderer when you create a client-side feature layer. A custom Unique Value renderer was implemented on the renderer to symbolize features and the labelling was implemented using a simple Arcade expression. In this example (Figure 3), I am using a Unique Value Renderer (which can accept up to three fields) to define the various combination of symbology based on the three data field values.
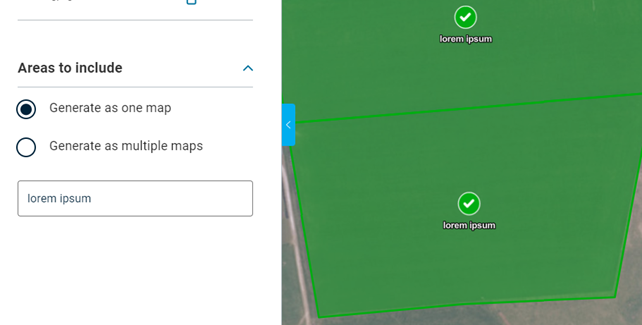
- If the three data fields "SELECTED, VALID and GENERATE_AS" have the values of "selected, valid, single", the cimSymbol will be displayed.
- If the three data fields "SELECTED, VALID and GENERATE_AS" have the values of "unselected, valid, single", the simple fill symbol with outline will be displayed.
- You can define various other combinations of these data field values to display the feature symbology.
const renderer = {
    type: "unique-value", // autocasts as new UniqueValueRenderer()
    field: "SELECTED",
    field2: "VALID",
    field3: "GENERATE_AS",
    fieldDelimiter: ",",
    uniqueValueInfos: [
        {
            value: "selected, valid, single",
            symbol: {
                type: "cim",
                // get JSON data defining CIMPointSymbol
                data: {
                    type: "CIMSymbolReference",
                    symbol: cimSymbol,
                },
            },
        },
        {
            value: "unselected, valid, single",
            symbol: {
                type: "simple-fill", // autocasts as new SimpleFillSymbol()
                style: "solid",
                outline: {
                    // autocasts as new SimpleLineSymbol()
                    color: [0, 174, 239],
                    width: 2,
                },
            },
        },
Figure 3 – Defining renderer
Labelling graphics
Labelling is defined using the labelingInfo property of the feature layer during its creation. The labelingInfo can take many individual label classes. Below (Figure 4) is an example of a label class that displays a label from the NAME data field whenever the feature's area is greater than 1000. You can add many label classes to display labels from different fields based on an Arcade expression.
new LabelClass({
    labelExpressionInfo: {
        expression:
            "IIF($feature.AREA > 1000, $feature.NAME, '')",
    },
});
Figure 4 – Defining label class
Conclusion
In summary the graphics layer is a good choice for simple client graphics or with mixed geometry types (point, lines or polygon). However, the client-side feature layer is my preferred choice to display client-side features because it demonstrates great performance and is easy to implement compared to the alternate complex workflows. This in turn leverages capabilities like renderer, labelling and applyEdits.
There are further capabilities provided by the client-side feature layer which I intend to explore in my next few Experience Builder applications e.g., working with client-side layer views.